

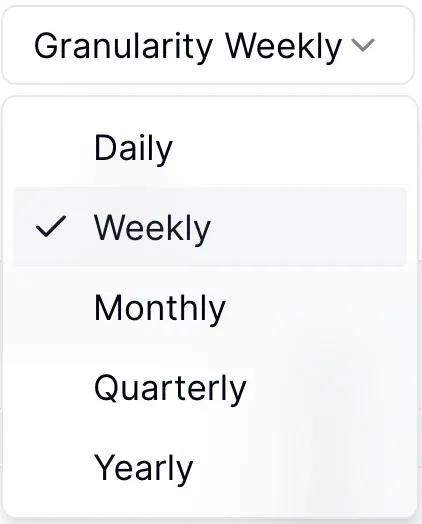
Report view 1
evidence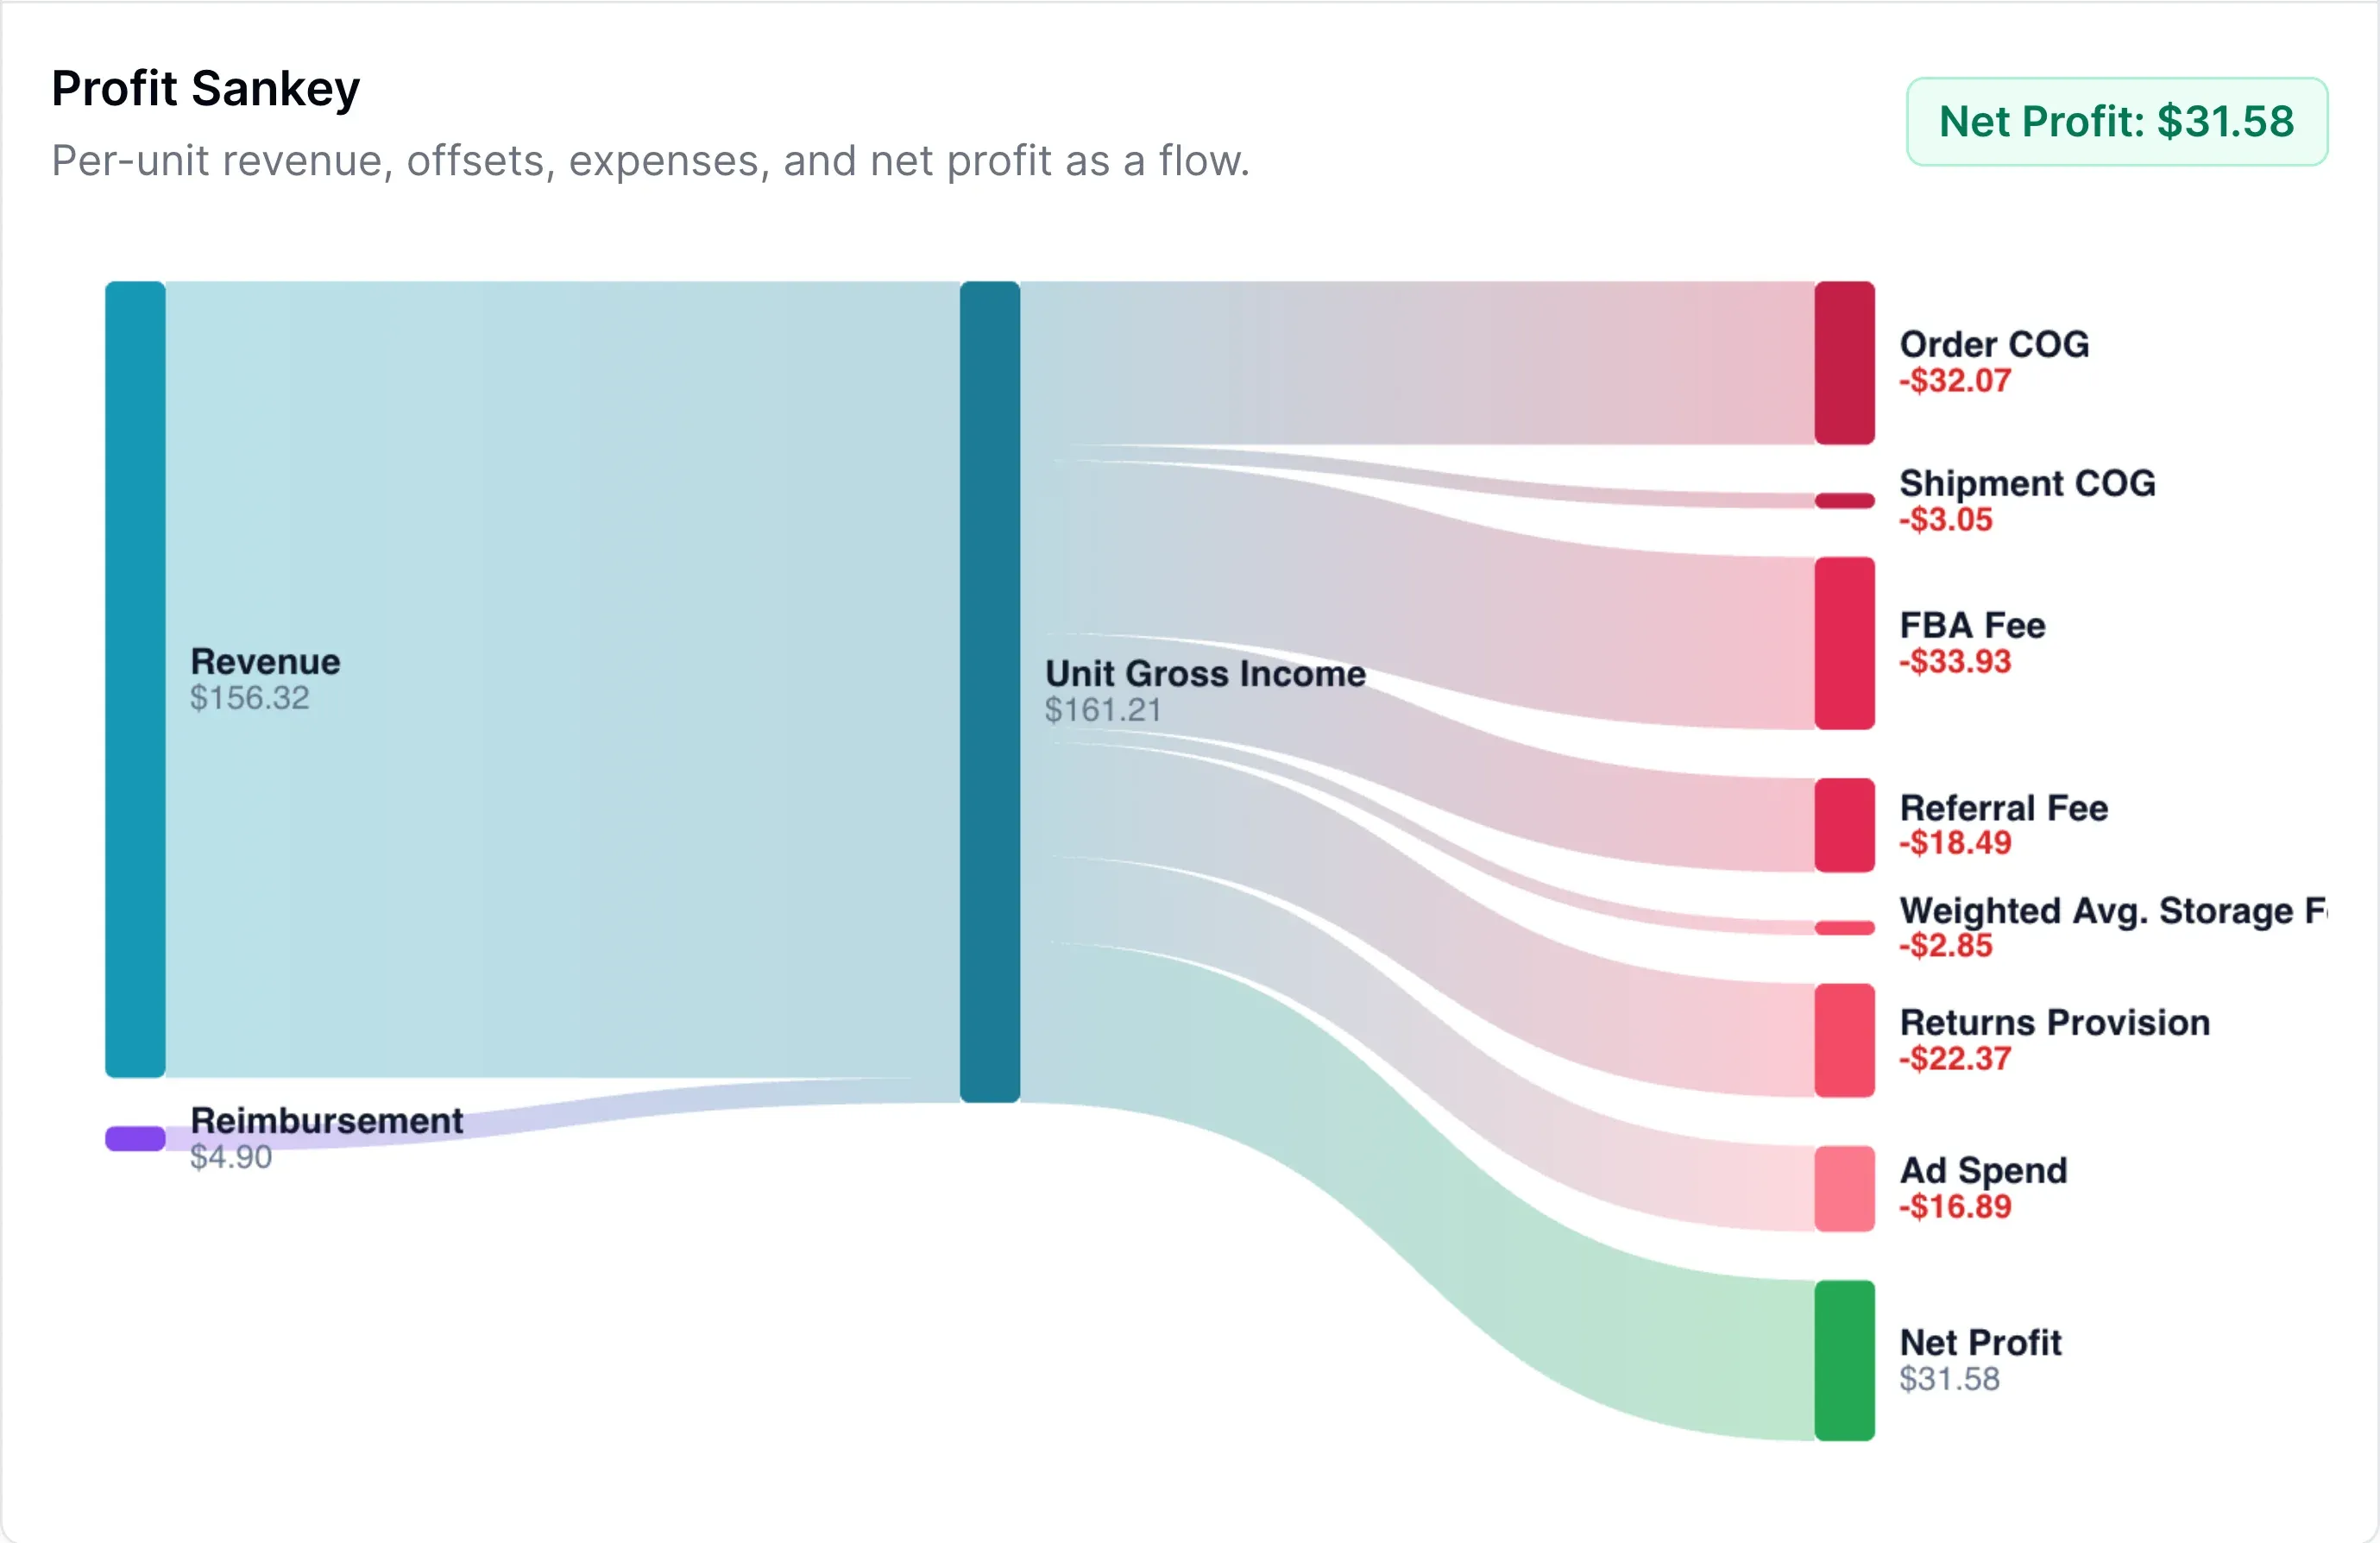
Profit bridge
See the profit drop split by fee, refund, price, and ad-efficiency drivers before changing budget.
This report breaks down what actually caused the change in your Amazon profit — so you act on facts, not guesses. 20x faster.
As featured in




Your profit dropped and you're guessing why — so you "fix" the wrong thing and it costs you more. See the drains behind the swings
Use case one
Profit drops often come from fees, refunds, and price changes — not just ads. Chasing the wrong cause is what makes a quick fix expensive.
surprise warehouse fee
refund spike — vs $210 average
ACOS — up from 18%
price crept up from $130
Use case two
A quarterly and yearly view shows which SKUs bleed margin — so you can reallocate capital to winners.
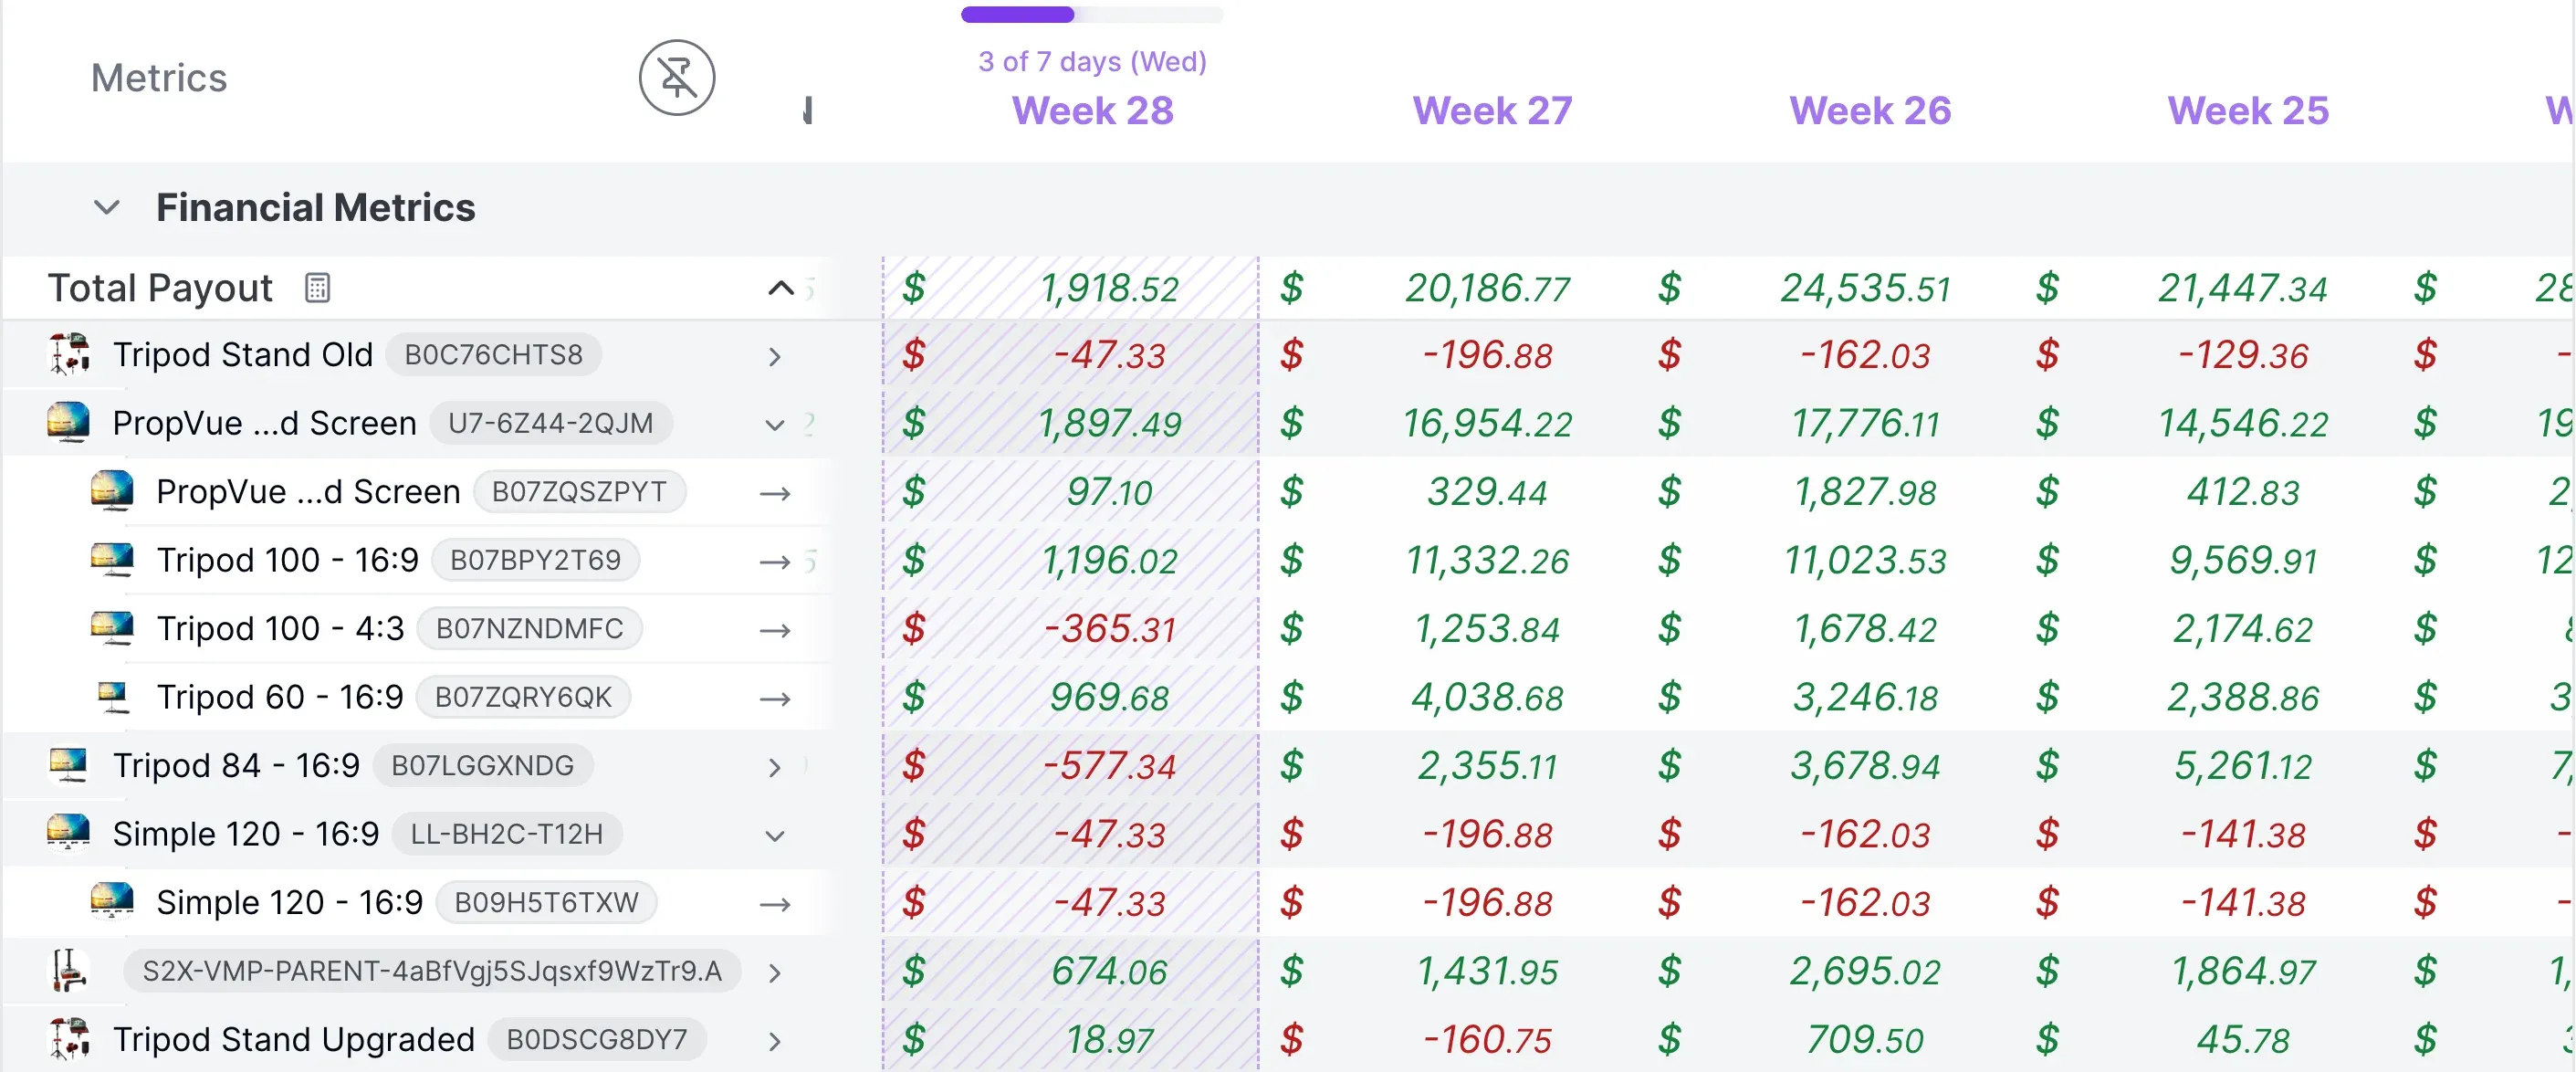
Evidence trail
Metrics ties each recommendation back to the exact report view a seller should inspect before acting.
Report view 1
evidenceSee the profit drop split by fee, refund, price, and ad-efficiency drivers before changing budget.
Report view 2
evidence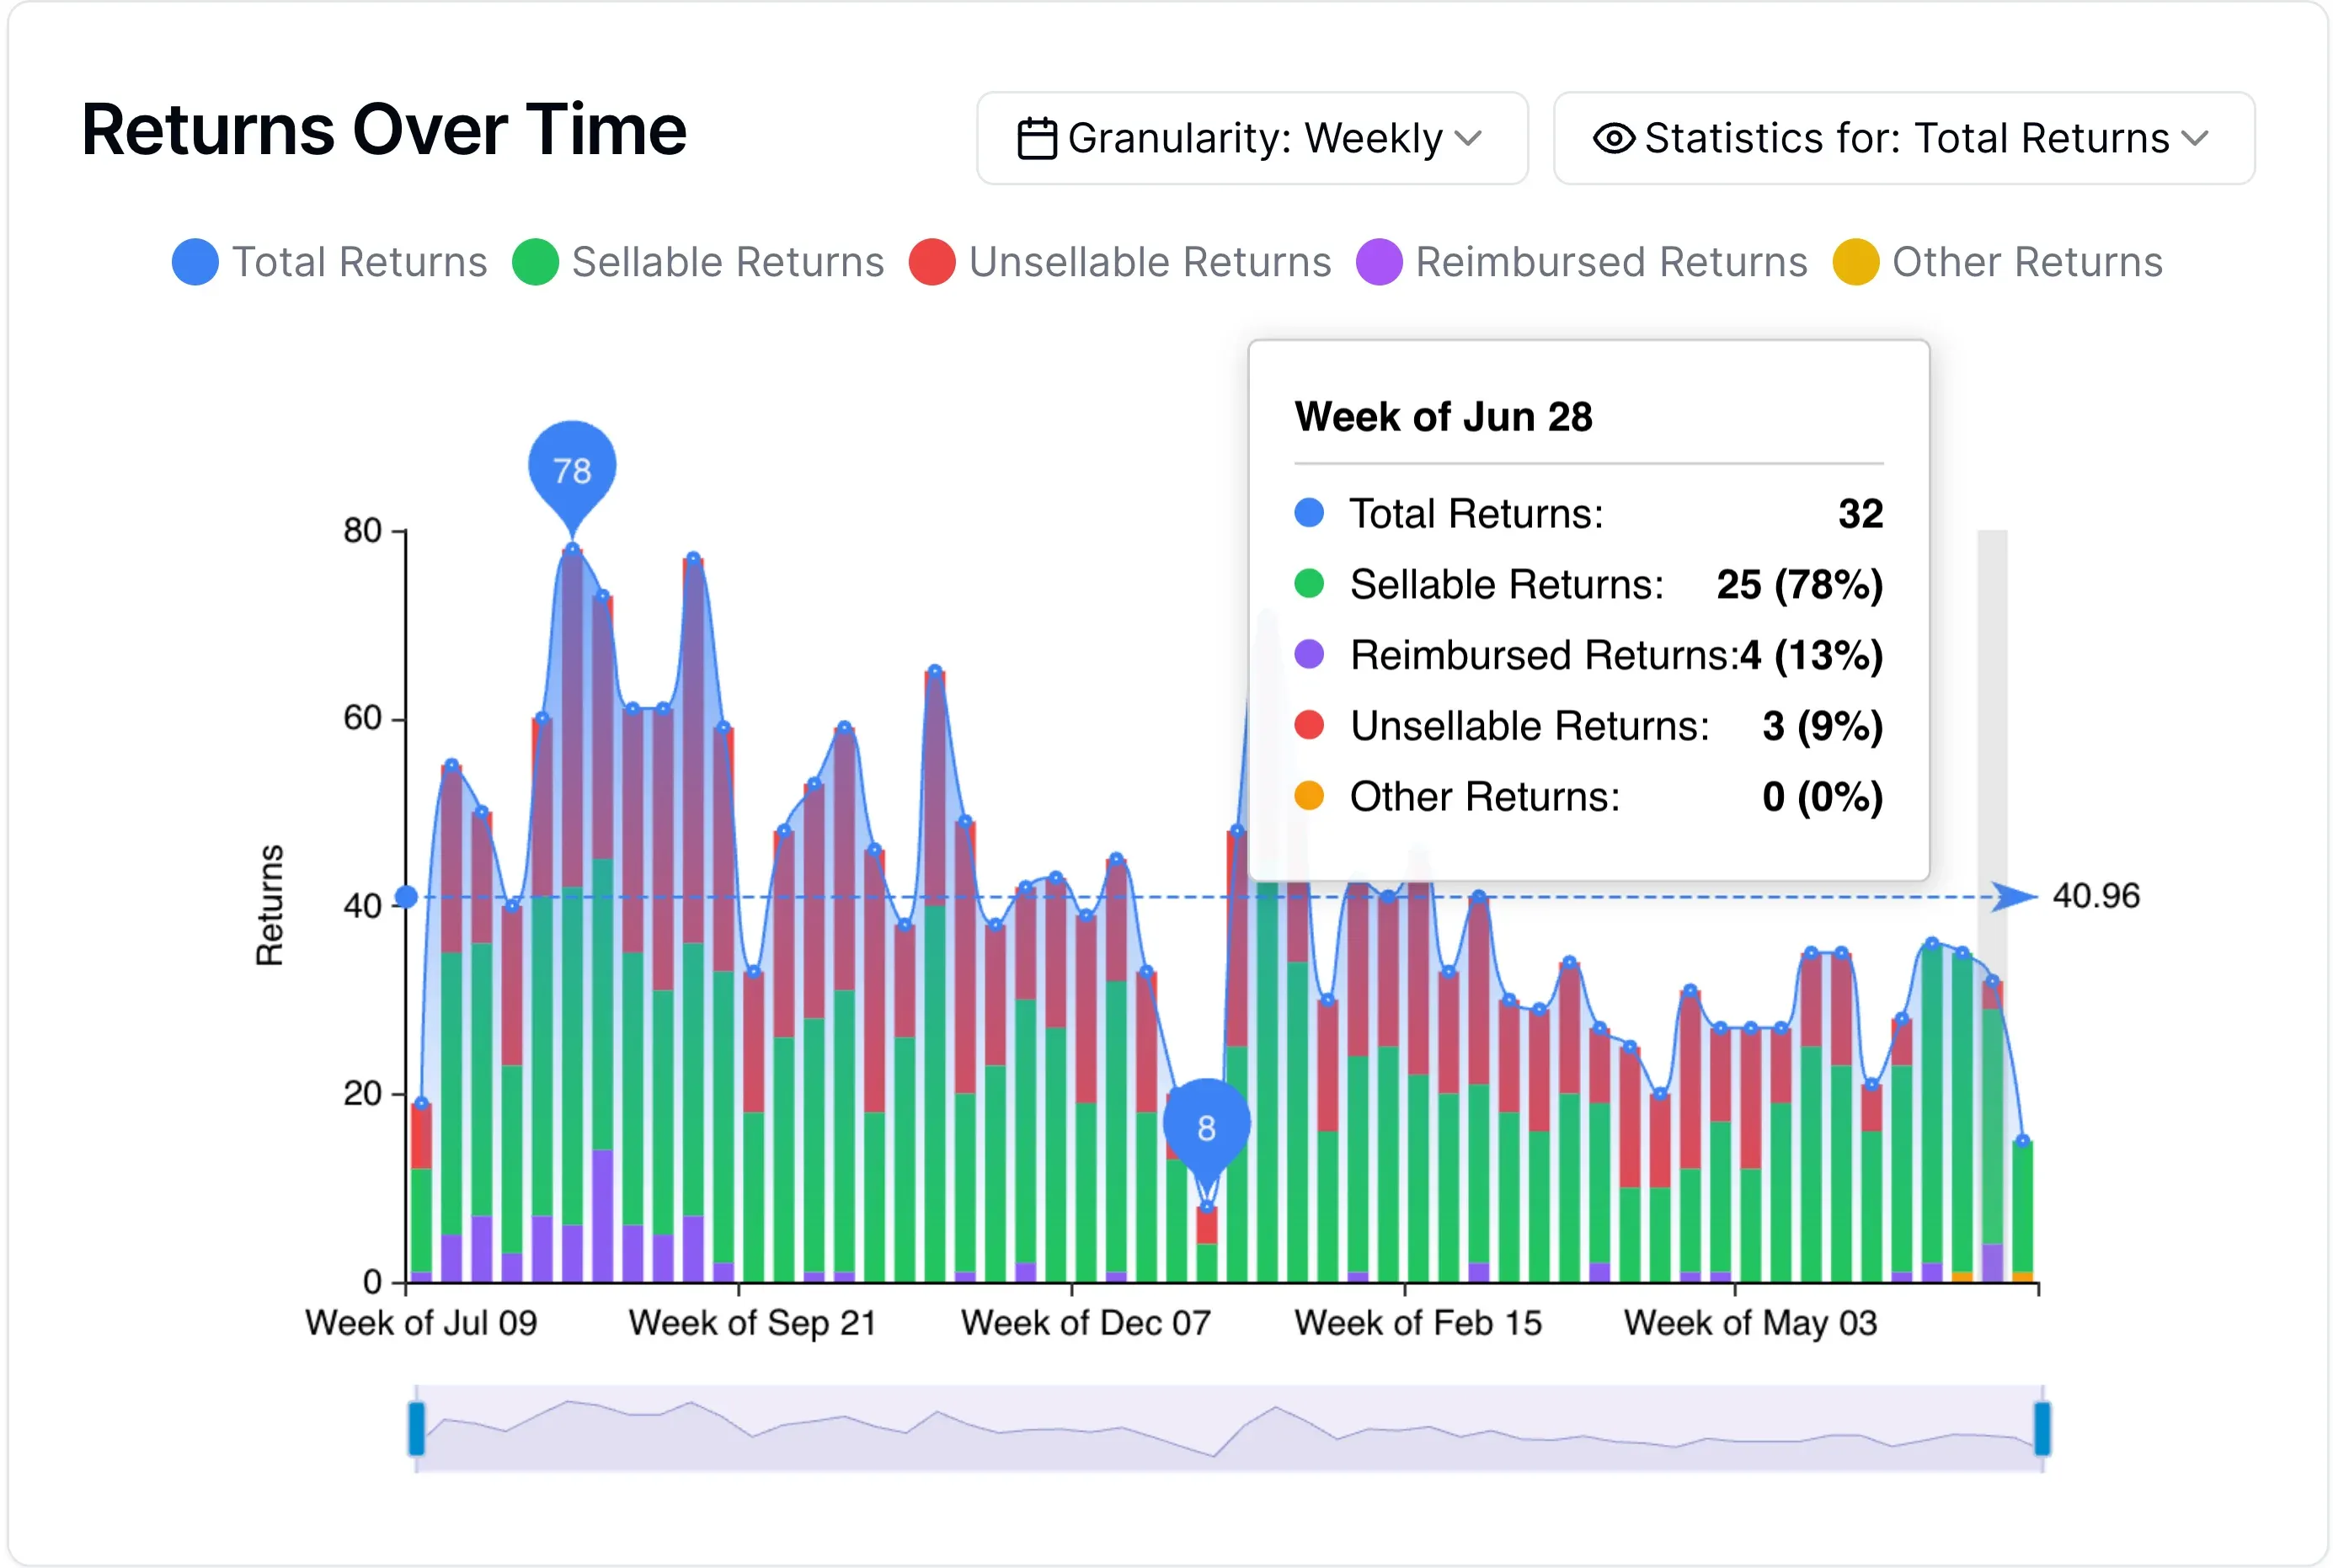
Pair the $890 spike with return reasons, affected SKUs, and the baseline it moved away from.
Report view 3
evidence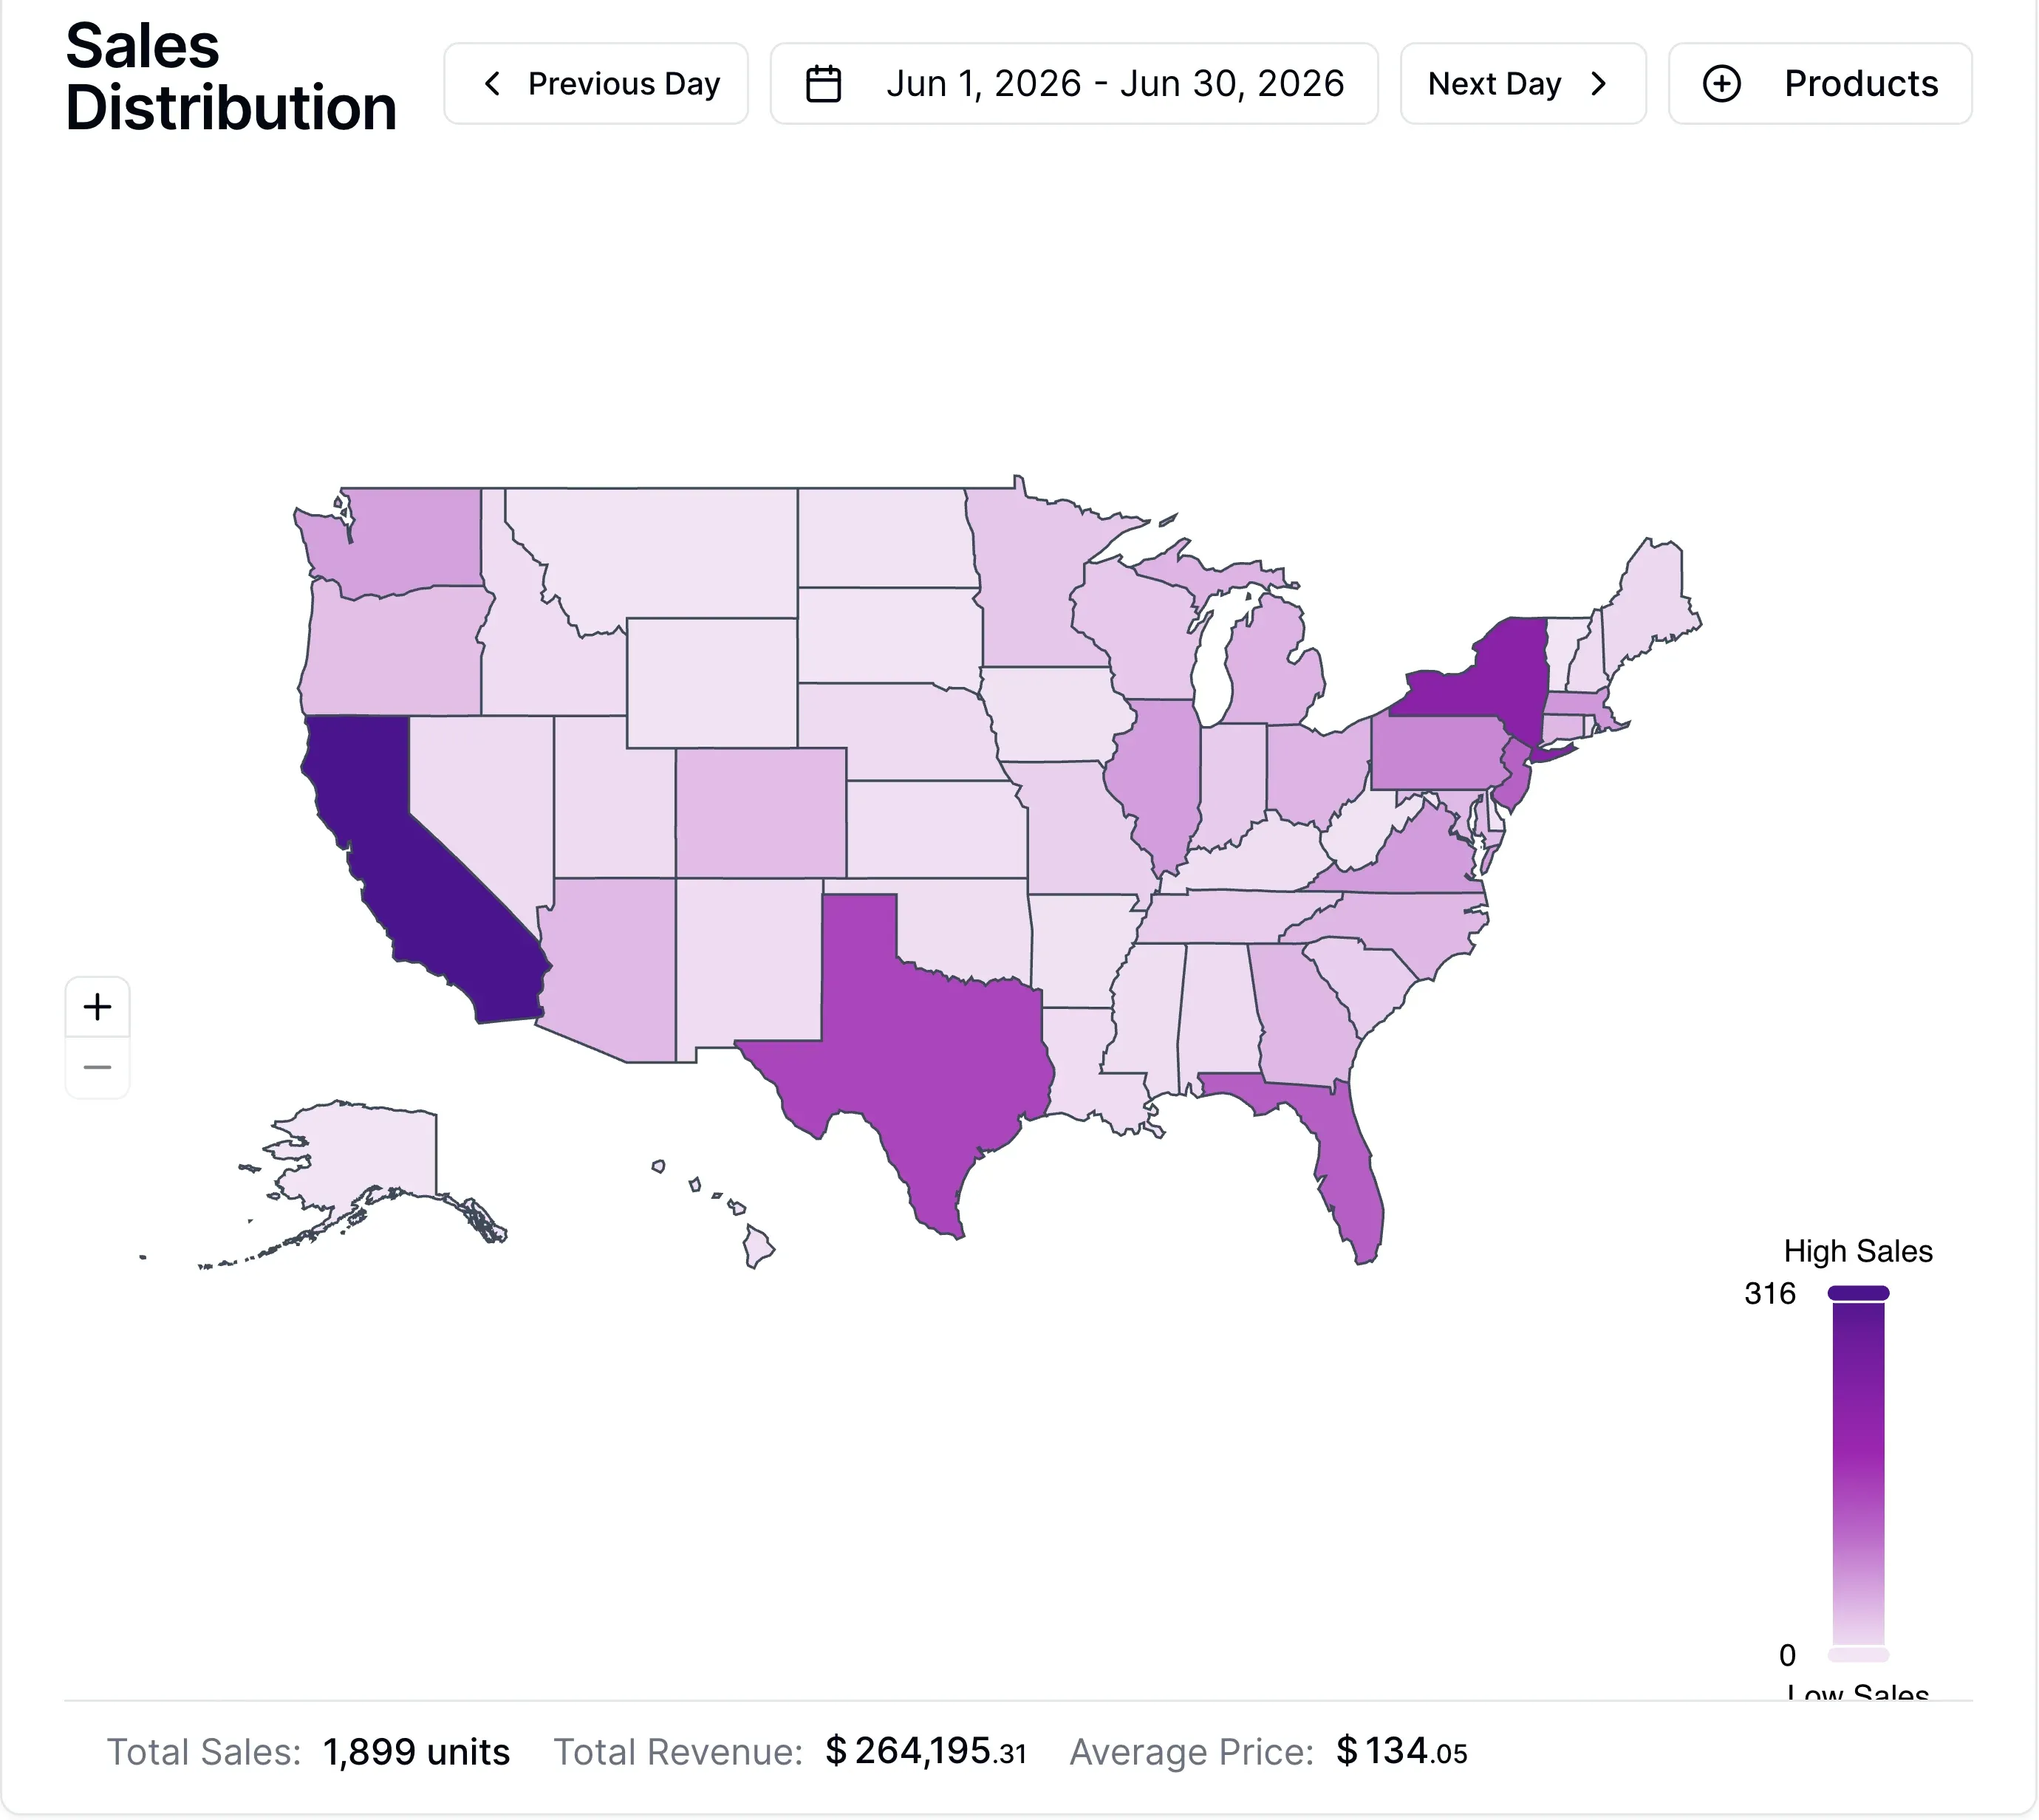
Spot which SKUs are freezing capital and which winners deserve the next inventory dollar.
What you get
See whether fees, refunds, or price moved your profit — not just that it moved.
Act on facts, not guesses
Connect your Amazon account and see exactly what moved your numbers — fees, refunds, price, or ads. No credit card required, 2 weeks free.